Sooner or later, you will find yourself making a flowchart. Obviously, this is already a very unfortunate circumstance, but it gets worse, because now you're going to research all the big players in the flowchart-making space only to find that they all involve a lot of clicking and dragging and are generally very tedious.
This happened to me recently, as you can guess. It would be nice if I could just declare what I want my flowchart to look like and then run something to make it so. If there is a tool for this, I couldn't find it, and I'm obviously not going to pay big SaaS money for it anyway, so I made one.
I called it chartctl and it's pretty simple. It will take a JSON file containing your desired flowchart config, and its internal sausage machine will make a PNG out of it. Here's a simple example of that JSON:
{
  "nodes": {
    "start": { "label": "Start Process" },
    "approval": { "label": "Request Approval" },
    "approved": { "label": "Approved" },
    "rejected": { "label": "Rejected" },
    "retry": { "label": "Retry Request" },
    "end": { "label": "End Process" }
  },
  "connectors": [
    { "from": "start", "to": "approval" },
    { "from": "approval", "to": "approved", "label": "Yes" },
    { "from": "approval", "to": "rejected", "label": "No" },
    { "from": "rejected", "to": "retry", "label": "Retry?" },
    { "from": "retry", "to": "approval" },
    { "from": "approved", "to": "end" }
  ]
}
"nodes" are the processes, decision points, and start/end blocks in your flowchart. "connectors" are the lines connecting them. You can call your nodes whatever you want. You can label your connectors whatever you want.
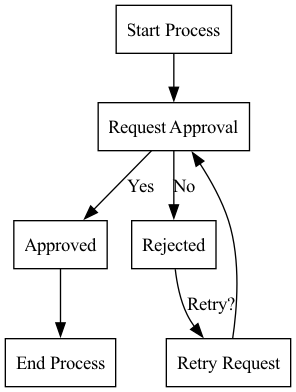
Create the flowchart out of this like so:
$ chartctl -i request_process.json -o request_processThis will generate the following PNG:
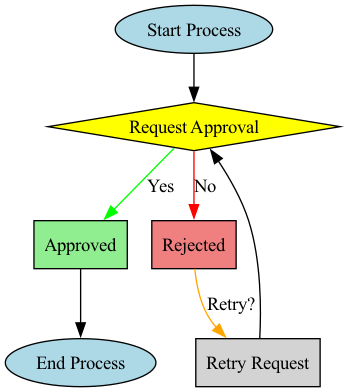
You can optionally add shapes and/or colors to the nodes and connectors too:
{
  "nodes": {
    "start": { "label": "Start Process", "shape": "oval", "fillcolor": "lightblue", "style": "filled" },
    "approval": { "label": "Request Approval", "shape": "diamond", "fillcolor": "yellow", "style": "filled" },
    "approved": { "label": "Approved", "shape": "rectangle", "fillcolor": "lightgreen", "style": "filled" },
    "rejected": { "label": "Rejected", "shape": "rectangle", "fillcolor": "lightcoral", "style": "filled" },
    "retry": { "label": "Retry Request", "shape": "rectangle", "fillcolor": "lightgray", "style": "filled" },
    "end": { "label": "End Process", "shape": "oval", "fillcolor": "lightblue", "style": "filled" }
  },
  "connectors": [
    { "from": "start", "to": "approval" },
    { "from": "approval", "to": "approved", "label": "Yes", "color": "green" },
    { "from": "approval", "to": "rejected", "label": "No", "color": "red" },
    { "from": "rejected", "to": "retry", "label": "Retry?", "color": "orange" },
    { "from": "retry", "to": "approval" },
    { "from": "approved", "to": "end" }
  ]
}
Adding those color and shape directives will create the following flowchart:
There's probably bugs and limitations with it, but it is Certified Good Enough for me.